
This Time It Probably IS Different
It’s been said that the four most dangerous words for investors are “this time it’s different.” If you’re not familiar with the saying, let me provide an example. In 1999, with the S&P 500 selling at 29x earnings, the bulls “reasoned” that stocks were still a buy because “this time it’s different. Yeah, stocks are very expensive, and it’s kind of reminiscent of the Nifty Fifty disaster of the late ‘60’s, but we’re in a 2nd Industrial Revolution. Moore’s Law (the doubling of microchip processing power every two years) has changed everything. The old metrics don’t apply. There is no limit to how high this market can go!”
Well, it wasn’t different. A grossly overvalued stock market and a very mild recession in 2000 led to an almost 50% decline in the S&P 500. The bulls got it right about Moore’s law and the expansion of earnings from digital age companies. What they didn’t get right were stock prices. Cisco’s business has done very well since 1999; sales and earnings have grown substantially. But at its high in 2000, the stock changed hands at $82 per share. Today it sells for $48.
With that history in mind, I’m going to go out on a limb and say that, with regards to the recession consequences of the current inversion of the yield curve (see last week’s blog post, The Whites of Their Eyes http://capitalistinvestment.com/blog/2019/08/16/The-Whites-of-Their-Eyes ), there is a very good chance that this time it IS different. In that post, I pointed out that
. . .every recession going back to 1969 was precipitated by the Fed raising rates to tamp down rising inflation. We are in a very different situation right now. Since mid-2011, the Core CPI has oscillated between 1.75-2.25%. It has been very stable. The Fed began raising rates in late 2015 to normalize rates after 7 years of its “zero-rate” policy, not in response to rising inflation.[1]
Brian Wesbury this week echoed my analysis:
The threat of a recession is on the minds of investors. Some traditional measures of the yield curve are inverted and, in the past, those have preceded recessions. The link between an inverted yield curve and a recession has so dominated recent financial news that for some investors it’s no longer a matter of whether we get a recession, but how long until it starts.
What these investors are ignoring is how different recent circumstances are from the environment that preceded prior recessions.[2]
He goes on to list all the unarguable ways the situation today is different from that preceding the previous four recessions. In 2008, we had a bubble in housing prices at a time when banks had significantly lower capital ratios than they have today, and were forced to use disastrous mark-to-market accounting rules for the valuation of their assets. None of those conditions exist today.
Most importantly, Brian details what I pointed out last week. Preceding the 1990 recession, the Consumer Price Index was up 5.40% in May of 1989. Prior to the 1981-1982 recession, inflation peaked at 14.8% in 1980. The Fed had no recourse except to raise rates until inflation began to decline. Today, inflation has been stable for the past 8 years and, if anything, is currently below the Fed’s target.
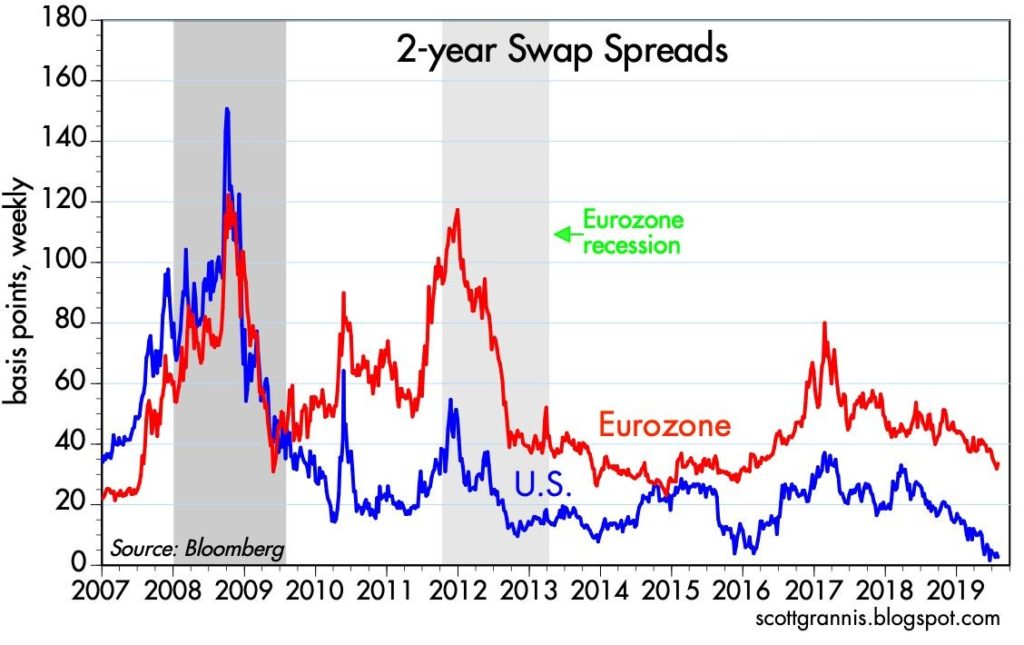
The current worry is not that the Fed has raised rates so high that it has inverted the yield curve and choked credit. Today’s fear is that the inverted curve is a portent of a U.S. recession because growth is slowing in Europe and China. But as you can see below, the Eurozone recession of 2011-13 did not lead to a recession here. In addition, 2-year Swap Spreads, a measure of credit stress, were severely elevated in Europe at the time, and that is not the case today. [3]
If slowing Chinese and European economies don’t fully explain the current state of our yield curve, what does? I believe that negative interest rates in Europe are one of the main culprits. If you’re not familiar with the term, here’s an explanation:
Negative interest rates refer to a scenario in which cash deposits incur a charge for storage at a bank, rather than receiving interest income. Instead of receiving money on deposits in the form of interest, depositors must pay regularly to keep their money with the bank. This environment is intended to incentivize banks to lend money more freely.[4]
Currently, rates in Germany are roughly (-.5%). Jeff Saut, of Saut Strategy, concurs. He believes
. . . participants should not take the action in the bond market as a recession signal. Rather we think it is all about capital flows from the rest of the world seeking a positive rate return in an environment where there is $16 trillion of paper with negative interest rates.[5]
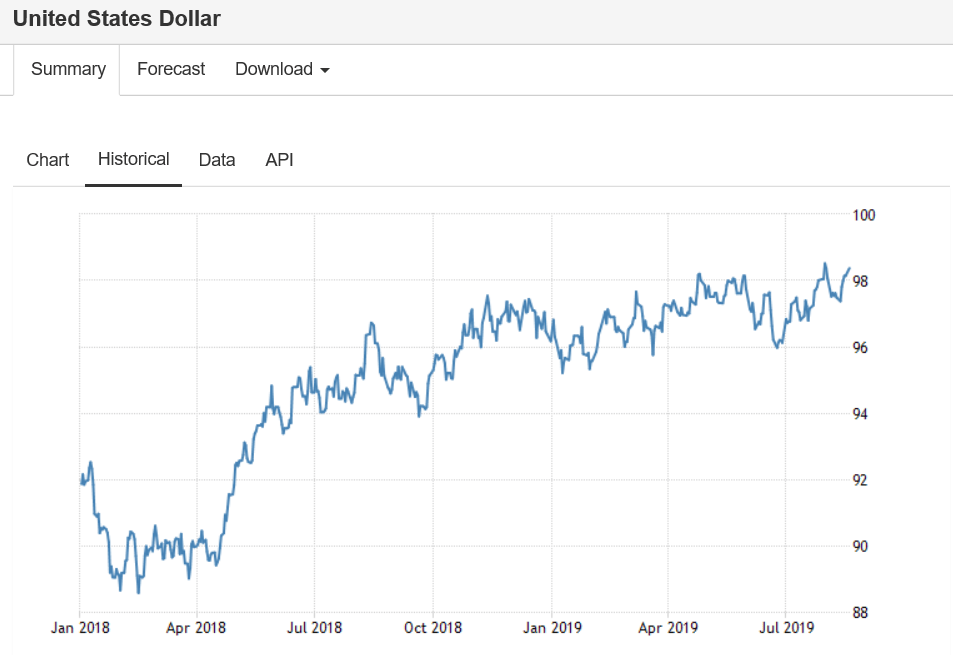
If overseas buyers are flocking to U.S. Treasuries, they are driving prices up and yields down. If you’re a German investor, the only reason you would not own U.S. fixed income is if you were worried about currency risk. At the moment, that seems negligible; the dollar has been in a steady uptrend for the past year.[6]
Bottom line – this time, the reason for our inverted yield curve may truly be different than the causes of this phenomena over the last fifty years, which could very well lessen the likelihood of a U.S. recession.
Don Harrison
8/21/19
The information contained in this report does not purport to be a complete description of the securities, markets, or developments referred to in this material. The information has been obtained from sources considered to be reliable, but we do not guarantee that the foregoing material is accurate or complete. Any opinions are those of Don Harrison, Scott Grannis , Brian Wesbury and Jeff Saut and not necessarily those of Raymond James. Expressions of opinion are as of this date and are subject to change without notice. There is no guarantee that these statements, opinions or forecasts provided herein will prove to be correct. Investing involves risk and you may incur a profit or loss regardless of strategy selected. Keep in mind that individuals cannot invest directly in any index, and index performance does not include transaction costs or other fees, which will affect actual investment performance. Individual investor’s results will vary. Past performance does not guarantee future results. Future investment performance cannot be guaranteed, investment yields will fluctuate with market conditions. The S&P 500 is an unmanaged index of 500 widely held stocks that is generally considered representative of the U.S. stock market. Forward looking data is subject to change at any time and there is no assurance that projections will be realized. All investments are subject to risk. Leading Economic Indicators are selected economic statistics that have proven valuable as a group in estimating the direction and magnitude of economic change. Raymond James is not affiliated with and does not endorse the services of Scott Grannis, Brian Wesbury, and Jeff Saut.
[1] The Whites of Their Eyes, Capitalist Investment Blog, Don Harrison, 8/16/19 http://capitalistinvestment.com/blog/2019/08/16/The-Whites-of-Their-Eyes
[2] This Is Not 2008, First Trust Monday Morning Outlook, 8/19/19 https://www.ftportfolios.com/retail/blogs/Economics/index.aspx
[3] Calfia Beach Pundit, Scott Grannis, “A Non-Fatal Fed Mistake,” 8/1/19 http://scottgrannis.blogspot.com/2019/08/a-non-fatal-fed-mistake.html
[4] Investopedia, https://www.investopedia.com/terms/n/negative-interest-rate.asp
[5] Tool Time, Saut Strategy, Jeffrey D. Saut, 8/9/19
[6] Chart from Trading Economics, https://tradingeconomics.com/united-states/currency
