
The Corona Quake
Thoughts on COVID-19:
- As with any “black swan” event (a surprise that has a major effect on the market), one of the most important things to remember is that if you own a diversified portfolio of stocks, you only lose money if you sell when the market is down. This is a truism, but it’s easy to forget when emotions are running high and the news media is warning of potential school closures, public-event cancellations and business disruptions.
- Since 2010, influenza has killed between 12,000 and 61,000 people annually in the United States.[1] In 2017-18 there were 45 million U.S. cases of the flu.[2] As of 2/25/20, there were 54 cases of COVID reported here, with no deaths.[3] In addition, in spite of our never ending arguments about health care in the U.S., we are much better equipped to deal with this than China and other developing nations. What we don’t know at the moment is the potential severity of the disease, and that is what is so unsettling to the markets. But if the past is any guide – SARS, Swine Flu, Ebola – this too shall pass.
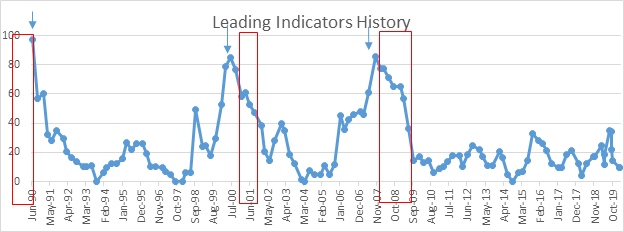
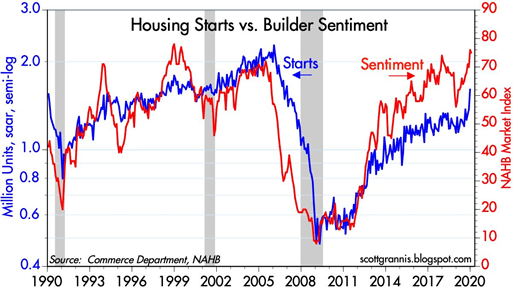
- My Leading Indicators – there is a great deal of talk right now about supply chain disruptions leading to a recession. This is very premature. Below is an updated (2/27/20) chart of the leading indicators that I use to assess the probability of a recession. (Red boxes are recessions.) 100 is as negative as it gets, and 0 is the most benign score. At the moment, my indicators are at 9, with a little softness in the manufacturing sector and heavy truck sales, and one cautionary monetary flag. Before the previous 3 recessions, these indicators scored between 80 and 90. In mid-2019, because of the inverted yield curve and a slowdown in housing, they were flashing yellow in the mid-30’s. Those concerns have now receded. Even with the last week’s drop in rates, the yield curve is not inverted, and housing is booming.[4]
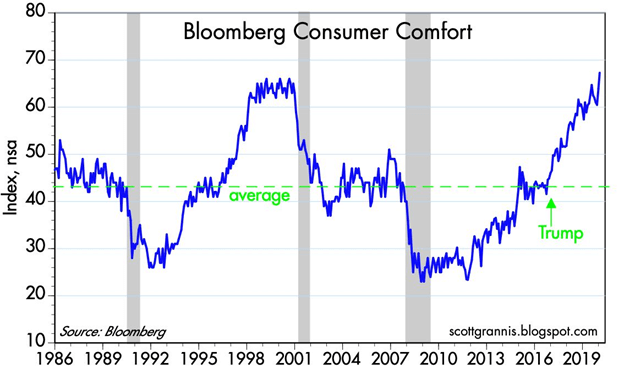
Consumer confidence is also at a record high. (Ironically, ex-mayor Bloomberg’s own index is telling him that, should he get the Democratic nomination, and should these conditions persist up until the election, his chances of unseating President Trump will be greatly diminished.)
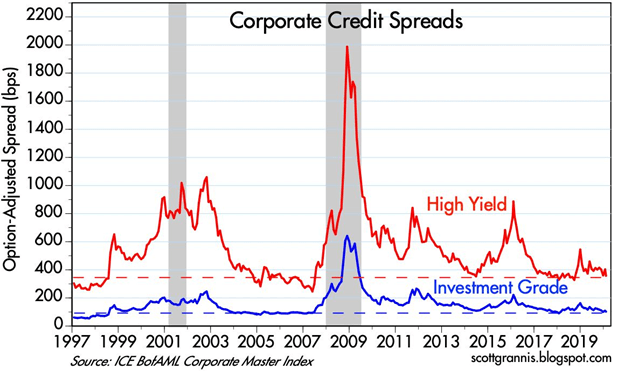
Corporate credit spreads are also low, and this implies that the market is not worried that profits will disappoint.[5]
4. The Absurdity of the “Flight to Safety” – right now, investors are fleeing stocks and piling into “safe” Treasury Bonds, which is driving yields on these bonds down to record lows. The 10-year U.S. Treasury currently yields 1.15%. This panic has knocked the price of Exxon stock from $71 at the beginning of the year to a current $49, and pushed the dividend yield on the stock up to 7.5%. Which makes more sense in the long run: a bond that will pay you money market rates for the next 10 years, or a blue chip company with a pristine balance sheet that currently yields more than junk bonds?
Bottom line: we are monitoring conditions, but at the moment the virus has had no real world impact on the economy that indicates an upcoming recession.
Don Harrison
The information contained in this report does not purport to be a complete description of the securities, markets, or developments referred to in this material. The information has been obtained from sources considered to be reliable, but we do not guarantee that the foregoing material is accurate or complete. Any opinions are those of Don Harrison and Scott Grannis, and not necessarily those of Raymond James. Expressions of opinion are as of this date and are subject to change without notice. There is no guarantee that these statements, opinions or forecasts provided herein will prove to be correct. Investing involves risk and you may incur a profit or loss regardless of strategy selected. Keep in mind that individuals cannot invest directly in any index, and index performance does not include transaction costs or other fees, which will affect actual investment performance. Individual investor’s results will vary. Past performance does not guarantee future results. Future investment performance cannot be guaranteed, investment yields will fluctuate with market conditions. The S&P 500 is an unmanaged index of 500 widely held stocks that is generally considered representative of the U.S. stock market. Forward looking data is subject to change at any time and there is no assurance that projections will be realized. All investments are subject to risk. Leading Economic Indicators are selected economic statistics that have proven valuable as a group in estimating the direction and magnitude of economic change. Raymond James is not affiliated with and does not endorse the services of Scott Grannis.
[1] CDC, “Disease Burden of Influenza,” https://www.cdc.gov/flu/about/burden/index.html
[2] https://www.cnsnews.com/article/international/michael-w-chapman/us-flu-season-2017-18-45-million-flu-cases-61000-deaths
[3] https://www.cnsnews.com/article/international/michael-w-chapman/us-flu-season-2017-18-45-million-flu-cases-61000-deaths
[4] Calafia Beach Pundit, “Bloomberg Watch Your Charts,” 2/4/20, http://scottgrannis.blogspot.com/2020/02/bloomberg-watch-your-charts.html
[5] Calafia Beach Pundit, “Updated Key Market Based Indicators,” 2/14/20, http://scottgrannis.blogspot.com/2020/02/updated-key-market-based-indicators.html
