
Riddle Me This
Though the coronavirus panic is no joke, over the last few days I’ve felt a little like Batman trying to solve one of the Riddler’s nefarious puzzles. Since Monday (3/23), as confirmed cases [1] and deaths have continued to increase, I’ve been pondering these questions:
- Those of us who are unfortunate enough to die from this disease do not pass away the same day we catch it. What is the lag time between infection and death?
- According to this report [2], “the median duration of Covid disease in severe cases is 20 days after symptom onset but on non-surviving patients median time to death is about 18.5 days. In these curves the shape of the logistic curve will depend on the date of general quarantine start resulting in sharp reduction of RO and the development that should show up at about 5 days incubation period plus 19 days to death for a total of 24 days.”
2. Are we able to make meaningful estimates of the lethality rate for those who are infected?
- As I detailed in my previous post[3], on the Diamond Princess cruise ship, 8 of the 712 who contracted the disease passed away. They were all over 70 years of age. This is a mortality rate of around 1%, but given the ages and health of the deceased, and the petri-dish environment, it suggests a much lower mortality rate for the general population.
- As of 3/26, Iceland had conducted random tests on 3.2% of its population.[4] This means that they have tested both those who appear to be sick and those who seem healthy. (In the U.S., this random test rate would mean that we tested 10 million people.) 6.3% of the people tested were positive, which extrapolates to total Icelandic infections of roughly 21,400. As of 3/26, there were two deaths from the virus in Iceland. This translates to a fatality rate of approximately .000093 of those infected, and 6 people per 1 million of population.
Why am I asking these questions, and what riddle am I trying to solve? Here’s the riddle: if it takes roughly 21 days for someone to pass away from this disease, and as of this week, between 141 and 268 people in the U.S. died each day, there is a huge discrepancy between the true number of U.S. cases and those being reported.
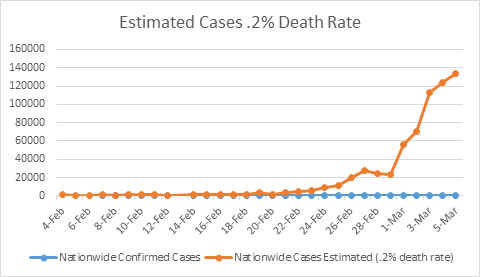
Here is a chart that assumes a death rate of .002 (double the typical U.S. death for the flu.) It is backward looking. For example, the first 2 confirmed cases occurred on 2/26. Given the expected time lag between infection and death, and a .002 death rate, this implies that on February 4th there were 1,000 active cases in the U.S. Based on 268 deaths yesterday, this suggests 134,000 cases on 3/5, well above the actual total of 221 tested and confirmed cases as of that date.
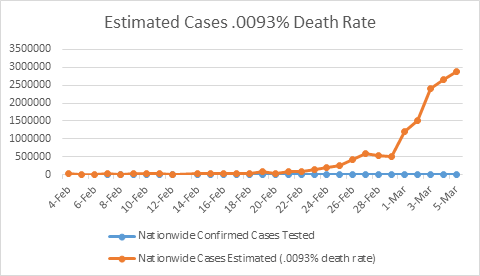
This next chart assumes a death rate of .000093. This is based on the Icelandic experience. This suggests there were already over 20,000 cases in the U.S. on 2/4, and the number of cases as of 3/5 was almost 3 million. We currently (3/26) have only 85,000 confirmed cases in the U.S. This may seem preposterous, but keep in mind that before President Trump closed travel with China, there had been hundreds of thousands of travelers going to and fro since the disease first appeared in China in November.
All of this may sound alarming at first glance, but it is actually a positive sign. We know the number of deaths, but unless we test a huge random sample in the U.S., we can only estimate the number of cases. The higher the true number of infections, the lower the mortality rate. Using the Icelandic experience of 6 deaths per million of population, this projects to an eventual total of U.S. deaths of roughly 2,000. If we assume a 100% infection rate in the U.S., (highly unlikely, and 15 times the 6.3% Icelandic rate), that translates to 30,000 U.S. deaths, right in the middle of the annual flu range.
As I was pondering all this on Monday and Tuesday, and wondering if I was crazy, two professors of medicine at Stanford published a piece in the Wall St. Journal confirming my reasoning:
If it’s true that the novel coronavirus would kill millions without shelter-in-place orders and quarantines, then the extraordinary measures being carried out in cities and states around the country are surely justified. But there’s little evidence to confirm that premise—and projections of the death toll could plausibly be orders of magnitude too high.
Fear of Covid-19 is based on its high estimated case fatality rate—2% to 4% of people with confirmed Covid-19 have died, according to the World Health Organization and others. So if 100 million Americans ultimately get the disease, two million to four million could die. We believe that estimate is deeply flawed. The true fatality rate is the portion of those infected who die, not the deaths from identified positive cases.
If the number of actual infections is much larger than the number of cases—orders of magnitude larger—then the true fatality rate is much lower as well. That’s not only plausible but likely based on what we know so far.[5]
Using real world data from China, Iceland, the NBA and the northern Italian town of Vo, Dr. Bendavid and Dr. Bhattacharya came to the conclusion that the likely lethality rate is around .01%, ten times less than the annual flu rate of .1%, and just barely above my estimate of .0093%.
Bottom Line – It is very likely that the lethality rate for COVID-19 will not be any higher than that of the annual flu, and probably significantly lower. Neal Ferguson of the Imperial College in London, whose model that predicted over 2 million deaths in the U.S. was the catalyst for much of our government action, has now walked back his estimate to that of normal, seasonal flu.[6]
Don Harrison, 3/27/20
The information contained in this report does not purport to be a complete description of the securities, markets, or developments referred to in this material. The information has been obtained from sources considered to be reliable, but we do not guarantee that the foregoing material is accurate or complete. Any opinions are those of Don Harrison, and not necessarily those of Raymond James. Expressions of opinion are as of this date and are subject to change without notice. There is no guarantee that these statements, opinions or forecasts provided herein will prove to be correct. Investing involves risk and you may incur a profit or loss regardless of strategy selected. Forward looking data is subject to change at any time and there is no assurance that projections will be realized.
[1] I can’t stress this enough – don’t forget that the “confirmed case” numbers do not reflect the actual number of cases, as most people with the disease are not being tested.
[2] Covid 19:A Tale of 3 Regions, https://www.nakedcapitalism.com/2020/03/covid-19-a-tale-of-three-regions.html
[3] http://capitalistinvestment.com/blog/2020/03/23/How-Did-We-Get-Here-and-Where-Will-We-Go
[4] https://fortune.com/2020/03/27/coronavirus-testing-us-iceland-cdc-trump-decode-covid-19-tests/
[5] https://www.wsj.com/articles/is-the-coronavirus-as-deadly-as-they-say-11585088464
