
Leading Indicators and the Trade War
With renewed talk in the financial press about the possibility that the trade “war” between the U.S. and China is leading to a recession, where do my Leading Indicators stand? At the moment, they are at 14, with 0 being the best score and 100 the worst. As you can see from the chart below [1], before each of the last three recessions (red boxes), the score ranged from 84 to 96.
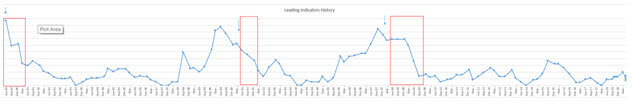
[1] Chart created by Don Harrison
Current Negatives
Monetary Policy — I don’t have an up-to-date chart of the 1-10 Yield Curve Slope (the difference between the yield on the 1 and 10 year Treasury Notes), but at the moment it is slightly negative at (-.05%). Typically, an inversion like this occurs when the Federal Reserve, in an effort to stem rising inflation, raises short term rates. Our current inversion, however, has been more the result of a decline in the 10 year yield. I suspect this may be occurring because of negative interest rates in Europe and the strength of the dollar. Why own Euro debt instruments that pay less than nothing, when you can buy Treasuries at 2%+ and benefit from a rising dollar? European demand has likely driven Treasury prices up and yields down.
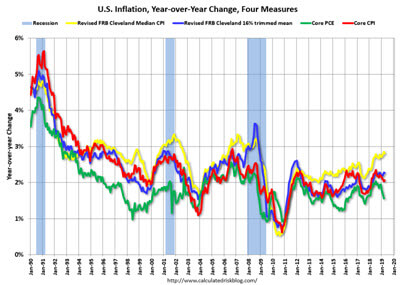
The 2-10 year spreads and the 10-30 year spreads are still positive. In addition, the Real Fed Funds rate does not indicate tight credit. It has risen from roughly (-2%) in 2012 to 1% today, an increase of 3%. In previous recessions, dating back to 1960, the increase has been anywhere from 4% to 7%. Though the Fed will probably not cut rates anytime soon, current inflation is declining (Core PCE and Core CPI) and does not warrant any rate increases.
Even though most monetary indicators are still positive, I have given the 1-10 Yield Curve Slope a negative rating.
Housing — As I mentioned at the beginning of November (Leading Indicators http://capitalistinvestment.com/blog/2018/11/01/Leading-Indicators/), the housing market was showing signs of strain, and 4 of its 6 components had moved into negative territory. Since then, New Home Sales and the NAHB Housing Market Index have righted themselves. I am still giving New Home Supply (chart below) a negative score, but it has begun to decline (a good thing!) and I can see this indicator getting a green light in the next few months.

Slightly Worrisome
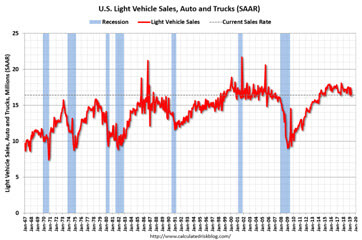
Light Vehicle Sales – As you can see from the chart below, a decline in Light Vehicle Sales preceded each of the past 6 recessions. At the moment, sales have been in a trading range for the past 4 years, but it wouldn’t take much of a falloff to turn this component of my index negative.
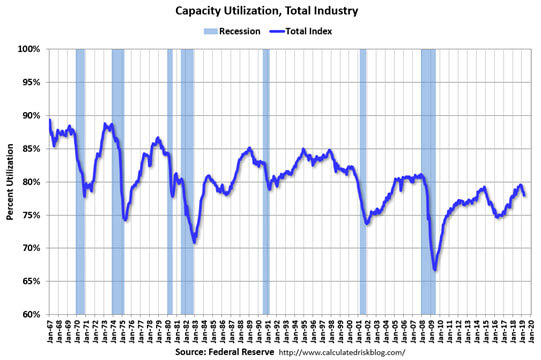
Capacity Utilization – This has also turned down, but not enough for me to move it the the negative column.
Bottom line on my Leading Indicators – In spite of a few breakdowns, they are mostly still positive, and nowhere near the levels that preceded the last 3 recessions.
The Trade War
The “trade war” is today’s headline worry. Trade conflicts have not caused a recession since Herbert Hoover signed the Smoot-Hawley Tariff in 1930. Even then, the Great Depression that followed might not have been so severe if interest rates and taxes had not been raised. Though there are currently plenty of numbskulls in Washington on both sides of the aisle, I believe that there is still enough understanding of history in D.C. to prevent an all-out trade war.
Brian Wesbury and Scott Grannis have some thoughts on the subject that don’t jive with conventional wisdom. Here are their conclusions. Read the full reports here (https://www.ftportfolios.com/retail/blogs/economics/index.aspx) and here (http://scottgrannis.blogspot.com/2019/05/us-and-china-play-trade-chicken-and.html)
Don’t panic if, and when, you hear of slow growth abroad. A large part of the reason is better policies in the US, which will help support growth here.[2]
Anyone can invent a scenario where some sort of Smoot-Hawley-like global trade war happens. Realistically, though, that appears very unlikely. We’re not the only advanced country China’s piracy has victimized, and China may realize it’s more isolated than it thought. In the end, China wants to trade with the West, not North Korea, Russia, and Venezuela. China needs the West. And all these trade war hysterics just aren’t warranted.[3]
Meanwhile, swap spreads and credit spreads remain relatively low. Liquidity conditions have not deteriorated, the Fed is not too tight, the dollar is not collapsing, and the US economy is likely to continue growing. What we see in the markets today is another panic attack which will likely be assuaged once the Chinese figure out a face-saving way of capitulating to Trump’s demands. That shouldn’t be too hard, since it ultimately will lead to a positive result for both the US and Chinese economies.[4]
The information contained in this report does not purport to be a complete description of the securities, markets, or developments referred to in this material. The information has been obtained from sources considered to be reliable, but we do not guarantee that the foregoing material is accurate or complete. Any opinions are those of Don Harrison, Scott Grannis and Brian Wesbury and not necessarily those of Raymond James. Expressions of opinion are as of this date and are subject to change without notice. There is no guarantee that these statements, opinions or forecasts provided herein will prove to be correct. Investing involes risk and you may incur a profit or loss regardless of strategy selected. Keep in mind that individuals cannot invest directly in any index, and index performance does not include transaction costs or other fees, which will affect actual investment performance. Individual investor’s results will vary. Past performance does not guarantee future results. Future investment performance cannot be guaranteed, investment yields will fluctuate with market conditions. The S&P 500 is an unmanaged index of 500 widely held stocks that is generally considered representative of the U.S. stock market. Forward looking data is subject to change at any time and there is no assurance that projections will be realized. All investments are subject to risk.
International investing involves special risks, including currency fluctuations, differing financial accounting standards, and possible political and economic volatility. Currencies investing are generally considered speculative because of the significant potential for investment loss. Their markets are likely to be volatile and there may be sharp price fluctuations even during periods when prices overall are rising. Leading Economic Indicators are selected economic statistics that have proven valuable as a group in estimating the direction and magnitude of economic change. United States Nahb Housing Market Index.
[2] Foreign Slowness Is Not An Obstacle, Brian Wesbury, First Trust Economics Blog, 5/28/19, https://www.ftportfolios.com/retail/blogs/economics/index.aspx
[3] Trade War Hysterics, Brian Wesbury, First Economics Blog, 5/13/19, https://www.ftportfolios.com/retail/blogs/economics/index.aspx
[4] U.S. and China Play Trade Chicken, and Both Are Likely to Win, Scott Grannis, Calafia Beach Pundit, 5/13/2019 http://scottgrannis.blogspot.com/2019/05/us-and-china-play-trade-chicken-and.html
