
The Whites of Their Eyes
When I was a pre-schooler . . . Actually, let me start over. When I was around five years old (there were no “pre-schools” in those days, and my mother didn’t believe in kindergarten, but somehow I managed to learn to read well before I started first grade), my maternal grandmother, Helen Musterman, would take me on regular trips to the Annapolis Public Library. At that time it was located on Church Circle, in what has now been rechristened “Reynold’s Tavern.” It was a dilapidated colonial era building, with a dirt floor in the basement where the children’s books were shelved. The steps were very steep and ladder-like, and since Nan was old and rickety (around my age now!), she would let me clamber down unaccompanied to explore and pick out my own books. One of my favorites was a book about the Revolutionary War. I took it out repeatedly, and still remember the pictures of the redcoats in their strange, tall hats, the damp mustiness of the basement, and how irritated I was when some stupid “baby” scribbled over some of the pages with a crayon.
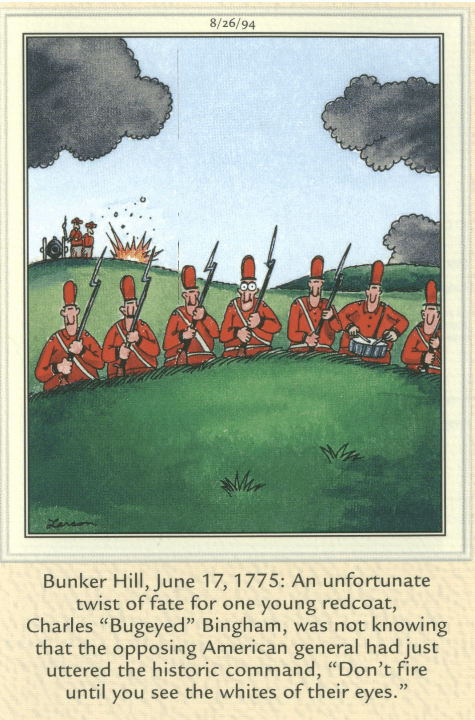
The reason I’m engaging in this bit of nostalgia is because the book contained an account of one of the opening battles of the war, The Battle of Bunker Hill. Technically, the British won the battle because, after repeated assaults, they forced the Colonials to withdraw from the heights above Charlestown. But it was a Pyrrhic victory; the redcoats took considerably more casualties, and the main reason the Colonials withdrew was because they ran out of ammunition. Legend has it that as the British advanced up the hill, militia Colonel William Prescott, in order to conserve ammunition, commanded his men “don’t fire until you see the whites of their eyes!”
Many clients are asking if the recession I have been discussing for the last year and a half is finally upon us. Is it time to “fire” your stocks and retreat to the safety of cash and bonds? And my answer is “I don’t believe so, because I can’t quite see the whites of this recession’s eyes!”
At the moment, the ostensible reason for the current market decline is the “inverted yield curve.” Normally, short term interest rates are lower than long term rates; investors have to be compensated with a higher rate of return in order to take on the extra interest rate risk associated with longer term bonds. An inverted curve means shorter term rates are now higher than longer term rates. Specifically, the current consternation regards the two and ten year treasury notes. Yesterday (8/15/19) the two year briefly rose above the ten year yield. Here is a long term chart of this relationship. The chart is as of 5/31/19. Blue line would be at 0 if it was current.
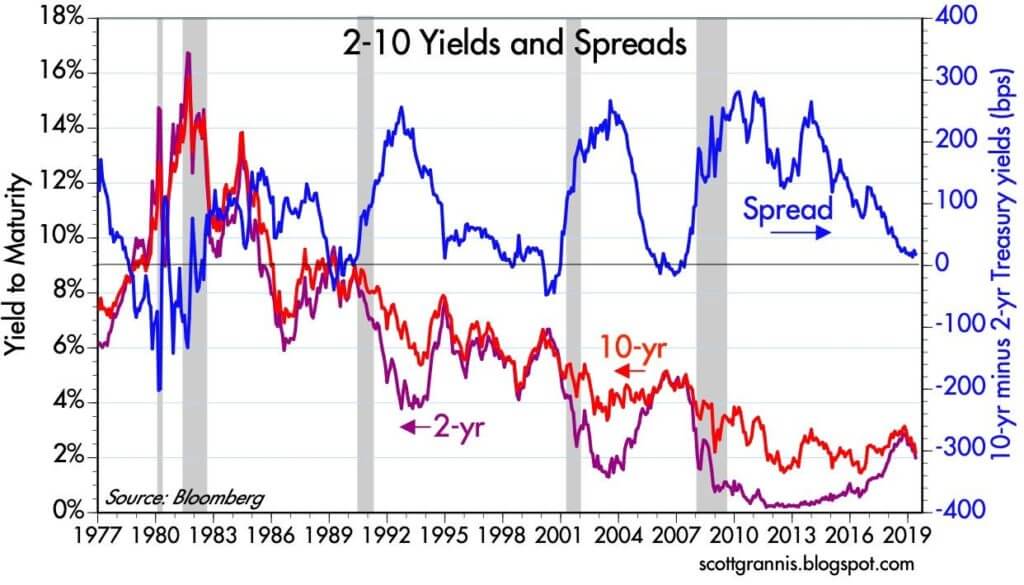
The yield curve for the 1-10 year Treasury Notes first inverted in March and has been bouncing in and out ever since.
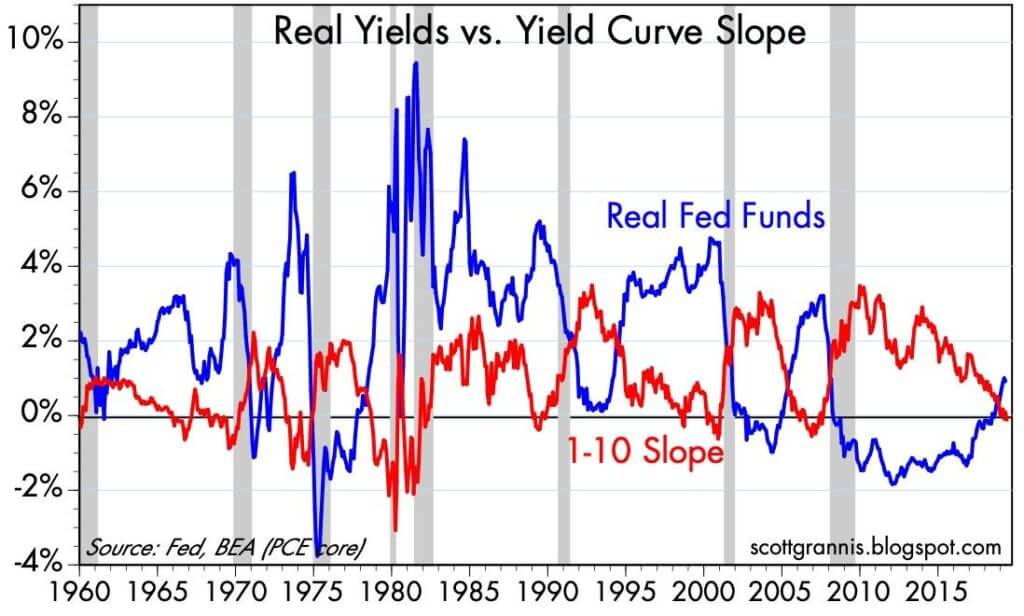
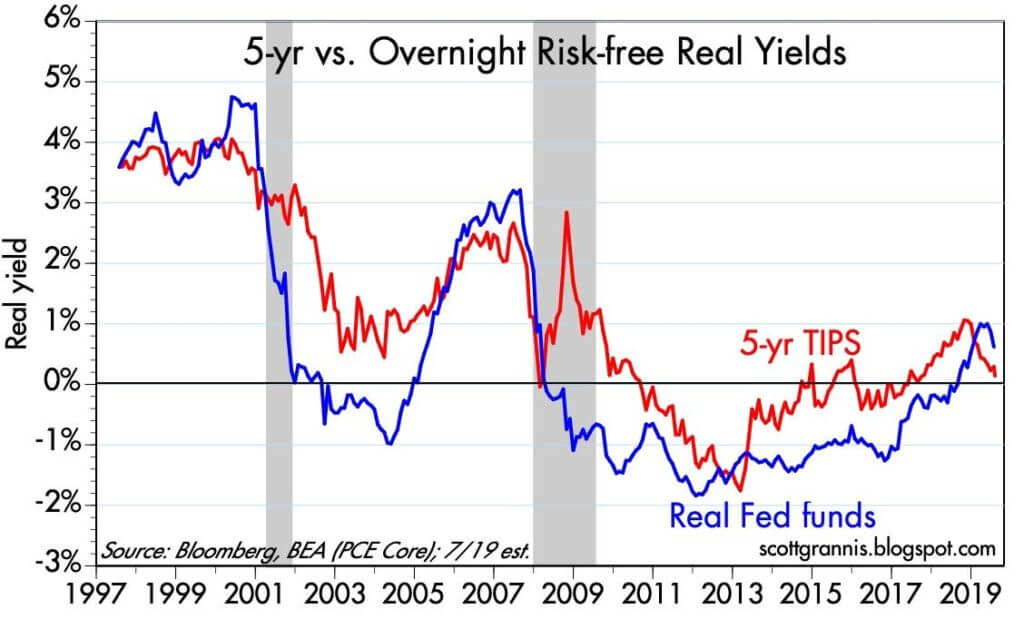
Another monetary indicator I follow, the difference between the yield on 5-yr. TIPS (Treasury Inflation Protected Securities) and Real Fed Funds has also moved into negative territory.
Of the four monetary indicators I follow, only the spread between the 10-30 yr. Treasury Bonds is still positive. It currently stands at +.44%
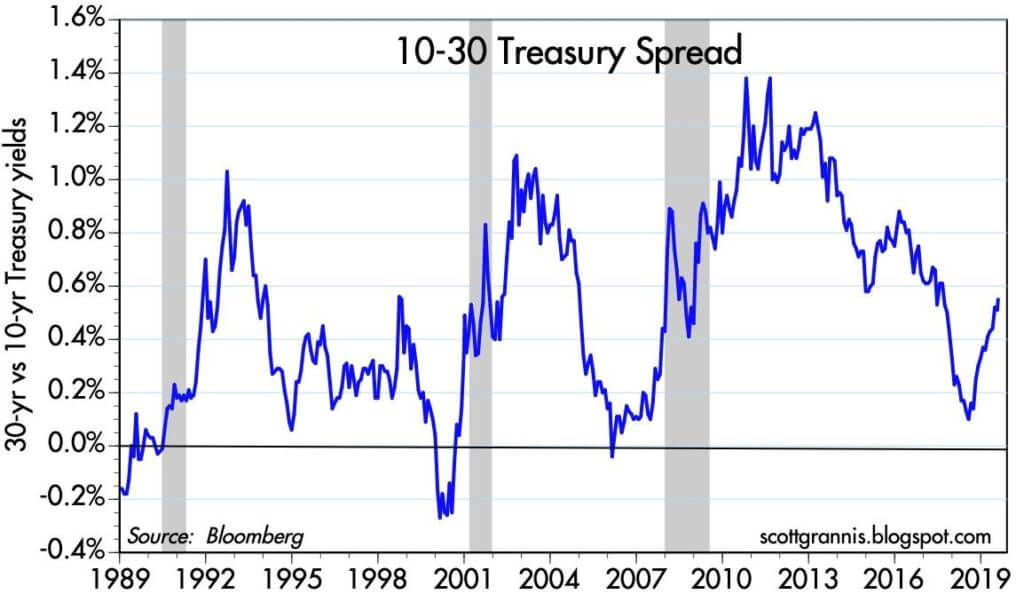
What does all this mean?
Though these are all very good indicators, and have almost invariably presaged a recession when they turn negative, there is usually a significant time lag between their warning signal and the top of the market. In the last recession, the average lag for the 4 indicators was 20 months, and for the 2001 recession it was 16 months. And a recession did not begin until all four of these indicators turned negative. The economy doesn’t surrender immediately when the yield curve inverts.
The reason it doesn’t is that it takes time for interest rate issues to take effect. At the moment, corporate credit spreads are still very healthy, and most of my real-world indicators – employment, vehicle sales, consumer and business confidence, housing, etc. – show little sign of deterioration.
In addition, every recession going back to 1969 was precipitated by the Fed raising rates to tamp down rising inflation. We are in a very different situation right now. Since mid-2011, the Core CPI has oscillated between 1.75-2.25%. It has been very stable. The Fed began raising rates in late 2015 to normalize rates after 7 years of its “zero-rate” policy, not in response to rising inflation. Because there is no current threat of inflation, there is room for them to lower rates, which they have already done by 25 basis points, and will probably do by 50 basis points in September, if not before.
The current consternation centers around slowing overseas’ economies and the growth-threatening nature of the tariff battle with China. I said “this about that” back in May, and my thoughts haven’t changed:
The “trade war” is today’s headline worry. Trade conflicts have not caused a recession since Herbert Hoover signed the Smoot-Hawley Tariff in 1930. Even then, the Great Depression that followed might not have been so severe if interest rates and taxes had not been raised. Though there are currently plenty of numbskulls in Washington on both sides of the aisle, I believe that there is still enough understanding of history in D.C. to prevent an all-out trade war.[6]
Below is the current status of my Leading Indicators.
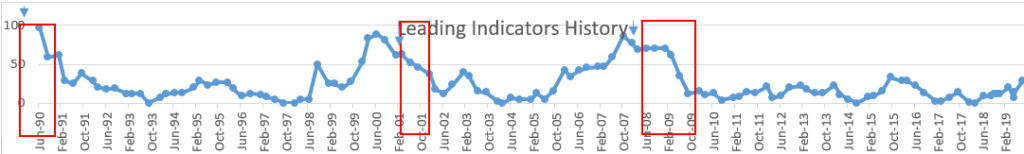
They now stand at 36, taking into account the recent inversions (0 is most positive, 100 most negative). Before the 3 previous recessions their level was 97, 88 and 86. Keep in mind that it has not always been a straight climb from current levels to recession territory. We had a rise to a similar point in this cycle in the fall of 2015, only to see the indicators subsequently fall back to 0. In the previous two cycles, there were also false alarms in 1998 and 2003.
Bottom line – though the current yield inversions could be the first warning shots of a recession, at the moment the likelihood of an imminent recession is not strong enough to make me take cover in cash and bonds. In my opinion, the “whites of its eyes” are still a ways off.
Don Harrison
8/16/19
The information contained in this report does not purport to be a complete description of the securities, markets, or developments referred to in this material. The information has been obtained from sources considered to be reliable, but we do not guarantee that the foregoing material is accurate or complete. Any opinions are those of Don Harrison and Scott Grannis and not necessarily those of Raymond James. Expressions of opinion are as of this date and are subject to change without notice. There is no guarantee that these statements, opinions or forecasts provided herein will prove to be correct. Investing involves risk and you may incur a profit or loss regardless of strategy selected. Keep in mind that individuals cannot invest directly in any index, and index performance does not include transaction costs or other fees, which will affect actual investment performance. Individual investor’s results will vary. Past performance does not guarantee future results. Future investment performance cannot be guaranteed, investment yields will fluctuate with market conditions. The S&P 500 is an unmanaged index of 500 widely held stocks that is generally considered representative of the U.S. stock market. Forward looking data is subject to change at any time and there is no assurance that projections will be realized. All investments are subject to risk. Leading Economic Indicators are selected economic statistics that have proven valuable as a group in estimating the direction and magnitude of economic change.
[1] Cartoon is from The Far Side by Gary Larson, courtesy of Pondering Principles, “Assessing the Battle of Bunker Hill,” Alan Snyder, 1/5/17. https://ponderingprinciples.com/2017/01/05/assessing-the-battle-of-bunker-hill/
[2] Calfia Beach Pundit, Scott Grannis, “Market to Fed: Two Rate Cuts Needed,” 5/31/19 http://scottgrannis.blogspot.com/2019/05/market-to-fed-two-rate-cuts-needed.html
[3] Calfia Beach Pundit, Scott Grannis, “Market to Fed: Two Rate Cuts Needed,” 5/31/19 http://scottgrannis.blogspot.com/2019/05/market-to-fed-two-rate-cuts-needed.html
[4] Calfia Beach Pundit, Scott Grannis, “Round Three of the Tariff Wars,” 8/5/19 http://scottgrannis.blogspot.com/2019/08/round-3-of-tariff-wars.html
[5] Calfia Beach Pundit, Scott Grannis, “Round Three of the Tariff Wars,” 8/5/19 http://scottgrannis.blogspot.com/2019/08/round-3-of-tariff-wars.html
[6] Capitalist Investment Blog, “Leading Indicators and the Trade “War,” Don Harrison, 5/30/19, http://capitalistinvestment.com/2019/05/leading-indicators-and-the-trade-war/
[7] Blue line – Leading Indicator level. Red boxes – recessions.
