
How Did We Get Here and Where Will We Go
I don’t have a PhD or a Nobel Prize, but Michael Levitt does, and he correctly predicted the course of the infection in S. Korea. Read his opinion about the future of the pandemic in the rest of the world: https://www.latimes.com/science/story/2020-03-22/coronavirus-outbreak-nobel-laureate
Knowns and Unknowns
At this moment, the two most pressing questions are: how did we get to this state of panic and commerce-debilitating government mandates, and when will the disease run its course and the economic disruption end?
How did we get here? I think everyone in the country above the age of 5 now knows the number of estimated annual seasonal flu deaths. Since 2010, they have run from 12,000 to 61,000.[1] I say estimated because we do not do extensive testing for the flu, and the information we have for the number of cases is an extrapolation from the people we do test. The often-cited figure of a .1-.2% mortality rate comes from these figures.
Based on early information from China and Italy, it looked like mortality rates for COVID-19 could be significantly higher than those of the flu. I believe that the initial concern that an easily-transmitted, quickly-spreading disease with mortality rates of around 3% could overwhelm our healthcare system was absolutely justified. We simply didn’t have enough information to react in any other way. However, since those early days, a number of “knowns” and almost “knowns” have come to light that should lessen the panic.
- The Diamond Princess: If we had designed an experiment to test for the spread and lethality of the disease, it would have been very hard to come up with anything better than the inadvertent one that occurred on this cruise ship. Out of 3,700 passengers and crew, 712 were infected and 8 have died. [2] This suggests a lethality rate of just over 1%. However, the cruise ship was an almost perfect petri dish, and does not reflect real world conditions. Initially, no one was aware of the disease, so passengers saw no need to “social distance.” Because of their confined spaces, cruise ships are a notorious incubator for all sorts of viruses. The average age of passengers and crew was 58, and 33% were 70 or older. All deaths were passengers over 70.[3] All this suggests it is not as easily spread as initially assumed, and the real world death rate will be significantly lower than 1%.
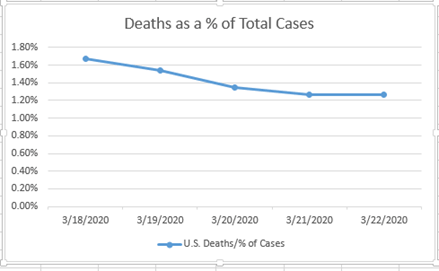
- As of 3/22, the death rate for tested cases in the U.S. is 1.27%. This has declined from 1.68% on 3/18.[4] It is now generally accepted that there are many asymptomatic or mild cases that are not being tested. Iceland has the highest testing rate in the world, and they have found that half of those tested have no symptoms.[5] Though this makes the spread of the disease more likely, it lowers the lethality rate. (The numerator – deaths – remains the same even if there is no testing; testing increases the denominator and consequently lowers the percentage of deaths.) Based on some anecdotal stories I have heard, many American doctors are telling people who report virus symptoms that if they are young with no underlying health issues, to stay home and only come in if the symptoms significantly worsen. This lack of testing also lowers the true lethality rate.
In spite of the criticism you might hear, the U.S. has ramped up testing at what I consider to be an astounding rate.[6]
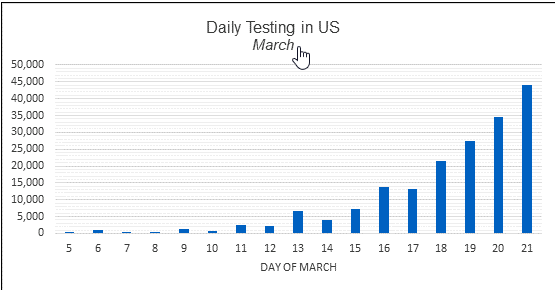
“By next Saturday, the US daily test capacity will likely be 100,000 – 125,000, approaching 1 million tests per week. This would give the US well more test capacity per capita than any other country in the world.”[7] Let me reiterate that as these testing numbers increase, the number of positive cases will increase at what may seem to be an alarming rate. But this should decrease the lethality rate.
- Based on the “knowns,” I offer a couple of estimates for eventual total deaths in the U.S.[8]
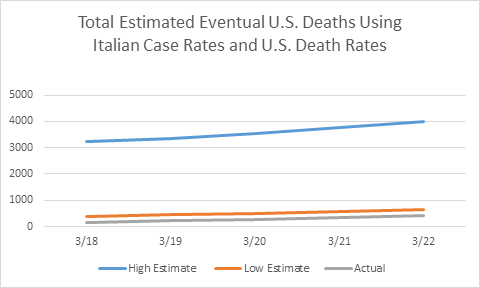
The methodology for these estimates is:
- For the low estimate, I have used the current Italian rate of cases per million (977), multiplied by the population of the U.S. (327.2 million), which gives you eventual expected total U.S. cases of 319, 674. I have then multiplied this figure by the U.S. death rate for influenza (.2%) to arrive at an eventual U.S. death total of 639. I believe this is probably overoptimistic.
- For the high estimate, I have used the same Italian rate of cases per million applied to the U.S. population. I have then multiplied this figure by the current U.S. death rate (1.27%). This results in an estimate of 4,059 eventual U.S. deaths. . I believe this is a pessimistic estimate because the U.S. is unlikely to reach Italian death rates and because the U.S. death rate will probably decline. (See the article cited below for the likely cause of the high Italian death rates.[9] By way of comparison, New York State currently has a death rate (866) approaching Italy’s, but a mortality rate (.9%), which is lower than the U.S. average.) What’s the reason for the different dates on the chart? These are estimates I made on those dates using this methodology. As the data changes, I am changing the estimates.
Here are some other estimates of eventual U.S. death rates. These use growth in U.S. cases multiplied by death rates. The dates here are the projected dates for total deaths.
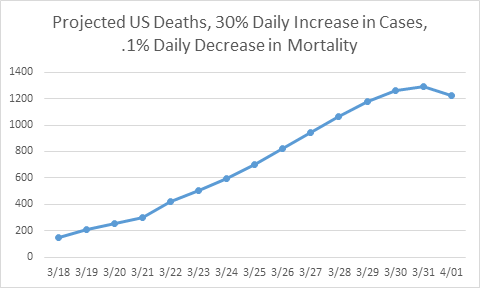
The first chart assumes a daily increase in cases of 30% (the rate since 3/11) and a starting mortality rate of 1.27% (the current rate), with a daily decrease in the mortality rate of .1% (the decrease since 3/18.) Numbers for all charts before 3/23 are actual figures.
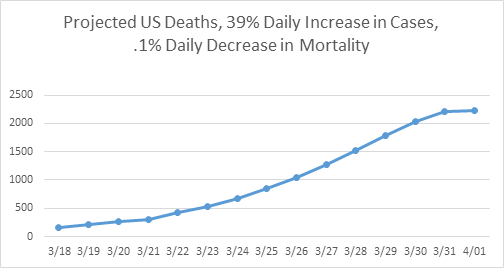
The second chart assumes a 39% daily increase in cases (the rate since 3/18) with the same daily decrease in mortality rate as the first chart.
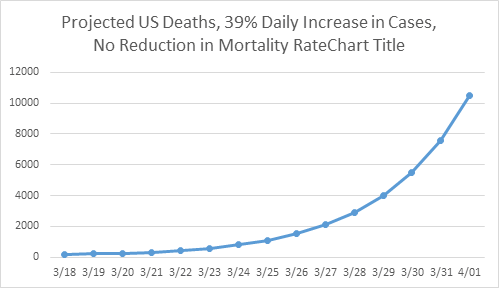
This third chart assumes what I believe is a highly unlikely scenario: cases continue to increase at a 39% daily rate, but there is no accompanying reduction in mortality rates. I have only carried this out to 4/1 because the end result of this is that eventually every person in the U.S. is infected resulting in over 4 million total deaths. Based on what we know now about mortality rates and mild and asymptomatic cases, this is a very, very low probability.
Some of the assumptions I have made – Italian death rates don’t climb above where they are now, the daily increase in US cases does not rise above 39%, mortality rates decrease – will certainly prove to be wrong, but probably not dramatically so. For example, the case growth rate may increase, but that will be offset by a decline in the mortality rate, based on the fact that we are testing more and more mild and asymptomatic cases. Looking at current known information, I believe the number of eventual US deaths will be within the range of annual flu deaths since 2010.
Bottom line – the initial fears were justified, but based on what we now know, and what we will learn in the very near future, the current draconian quarantine measures will seem less and less necessary.
I will have thoughts on the second question I posed at the beginning – when will the economic disruption end? – in the next few days.
Don Harrison, 3/23/20
The information contained in this report does not purport to be a complete description of the securities, markets, or developments referred to in this material. The information has been obtained from sources considered to be reliable, but we do not guarantee that the foregoing material is accurate or complete. Any opinions are those of Don Harrison, and not necessarily those of Raymond James. Expressions of opinion are as of this date and are subject to change without notice. There is no guarantee that these statements, opinions or forecasts provided herein will prove to be correct. Investing involves risk and you may incur a profit or loss regardless of strategy selected. Forward looking data is subject to change at any time and there is no assurance that projections will be realized.
[1] Disease Burden of Influenza, https://www.cdc.gov/flu/about/burden/index.html
[2] What Have Scientists Learned About COVID-19 And Coronavirus By Using Cruise Ship Data? https://www.forbes.com/sites/victoriaforster/2020/03/22/what-have-scientists-learned-from-using-cruise-ship-data-to-learn-about-covid-19/#5e47c607406d
[3] Cruise Ship Data Reveal Corona Virus Death Rate:Researchers, https://www.foxnews.com/us/cruise-ship-data-helps-reveal-coronavirus-death-rate-researchers
[4] Information source — https://www.worldometers.info/coronavirus/
[5] Coronavirus Cases Without Symptoms Spur Call for Wider Test, https://www.bloomberg.com/news/articles/2020-03-22/one-third-of-coronavirus-cases-may-show-no-symptom-scmp-reports
[6] Rapid Progress on COVID Testing, https://www.powerlineblog.com/archives/2020/03/rapid-progress-on-covid-testing.phpAll figures regarding testing from this site.
[7] Rapid Progress on COVID Testing, https://www.powerlineblog.com/archives/2020/03/rapid-progress-on-covid-testing.phpAll figures regarding testing from this site
[8] All figures for these estimates from https://www.worldometers.info/coronavirus/
[9] Why Have So Many Coronavirus Patients Died in Italy?, https://www.telegraph.co.uk/global-health/science-and-disease/have-many-coronavirus-patients-died-italy/
