
Recession Indicator Update
It has been a year since my last blog post, and the long interregnum has two causes:
- The “COVID Recession” was a true “Black Swan” economic event[1], probably the first in my lifetime. By definition, a Black Swan comes out of the blue, so there was no way to prepare for it, and my Leading Recession Indicators were useless.
In fact, by the classic definition of a recession – two consecutive quarters of negative GDP – this was not a recession at all, as economic growth began to rebound in 2-3 months. There was no sense writing about something that was clearly going to end as the COVID situation improved, and the rational investment response was simply to “shelter in place” and wait it out. - I wrote a number of blog posts about COVID last spring, but stopped after my post in May for two reasons:
- The “virus was going to virus” until herd immunity was reached, either through natural infection or a vaccine, or some combination of the two.
- Governments – national and in many cases state and local also – were going to continue to defend the measures they took to attempt to lessen the severity of the pandemic and ignore any potentially contradictory evidence.
Given these two factors, I didn’t see much point in belaboring the obvious or beating my head against a wall; however, the economy and the COVID situation have changed, and it seems appropriate to get back into the blogging saddle.
Why Is the Stock Market Performing So Well?
Recently folks have been asking me a version of the following question: given the potential for economically unfriendly mischief by the Biden administration (tax hikes, diminished fracking, an increase in the minimum wage, the PRO Act, etc.) why is the market at all-time highs? I believe there are two factors driving the market euphoria: we are now at the end of the COVID pandemic, and the Fed is being incredibly accommodative. In the short term, these positives are probably trumping any regulatory-policy negatives, even though the government’s unprecedented actions could have serious long-term consequences, as Scott Grannis has detailed in “The Fed and Our Politicians Are Playing With Fire”.[2]
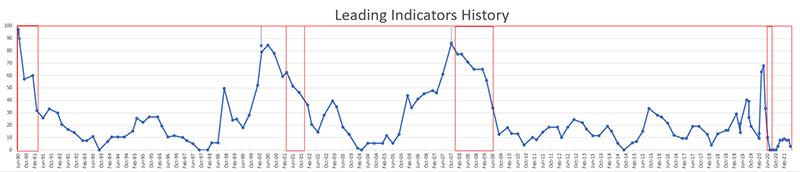
My Recession Indicators[3]
Prior to the recessions of 1990, 2001 and 2008, my indicators rose above 80. Last year before the COVID downturn they hit 68. (A score of 100 means all of the 28 pieces of economic data I use are negative; a score of 0 means none are. Red boxes indicate recessions.) Currently my indicators stand at 3. The only negative one is “Small Business Hiring Plans.” This is not surprising given the generous unemployment benefits that incentivize workers to stay at home.
Though there appear to be no recession omens at the moment, we are watching things very closely, given the witch’s brew of regulatory, fiscal and monetary policy now fermenting in Washington.
The information contained in this report does not purport to be a complete description of the securities, markets, or developments referred to in this material. The information has been obtained from sources considered to be reliable, but we do not guarantee that the foregoing material is accurate or complete. Any opinions are those of Don Harrison and Scott Grannis , and not necessarily those of Raymond James. Expressions of opinion are as of this date and are subject to change without notice. There is no guarantee that these statements, opinions or forecasts provided herein will prove to be correct. Investing involves risk and you may incur a profit or loss regardless of strategy selected. Keep in mind that individuals cannot invest directly in any index, and index performance does not include transaction costs or other fees, which will affect actual investment performance. Individual investor’s results will vary. Past performance does not guarantee future results. Future investment performance cannot be guaranteed, investment yields will fluctuate with market conditions. The S&P 500 is an unmanaged index of 500 widely held stocks that is generally considered representative of the U.S. stock market. Forward looking data is subject to change at any time and there is no assurance that projections will be realized. All investments are subject to risk. Leading Economic Indicators are selected economic statistics that have proven valuable as a group in estimating the direction and magnitude of economic change. Raymond James is not affiliated with and does not endorse the services of Scott Grannis.
[1] The black swan theory or theory of black swan events is a metaphor that describes an event that comes as a surprise, has a major effect, and is often inappropriately rationalised after the fact with the benefit of hindsight. The term is based on an ancient saying that presumed black swans did not exist – a saying that became reinterpreted to teach a different lesson after the first European encounter with them. Wikipedia https://en.wikipedia.org/wiki/Black_swan_theory
[2] Scott Grannis, Califia Beach Pundit, The Fed and Our Politicians Are Playing With Fire
http://scottgrannis.blogspot.com/2021/05/the-fed-and-our-politicians-are-playing.html
[3] The Capitalist Investment Leading Indicators is a composite comprised of the following data: Real Yields and the Yield Curve Slope; 1-10 Treasury Slope; Five Year vs. Overnight Risk Free Yields; 2-10 Treasury Spread; 2-10 Treasury Spread and Real Fed Funds; 10-30 Treasury Spread; 10-30 Treasury Spread and Real Fed Funds; 2 Yr. Swap Spreads; Corporate Credit Spreads; Corporate Profits as a % of GDP; Institute for Supply Mgn PMI; Capacity Utilization; 24 Month Payroll; Small Business Optimism; Small Business Hiring Plans; Consumer Confidence; Light Vehicle Sales; Unemployment Rate; State Unemployment Rates; Year/Year Change in Employment; Heavy Truck Sales; Initial Weekly Unemployment Claims; U.S. Household Leverage; Housing Starts; New Home Sales; NAHB Indicator; New Homes Supply; Housing Starts 12 Month Average
