
More “Duh!” and Updated Recession Indicators
The Inflation Clown Show -- Back in January, in a blog post entitled “Duh!”[1], I argued that the root cause of the recent surge in inflation was not supply chain issues or greedy oil companies, but the staggering increase in the money supply that our government has created since the spring of 2020. Since I wrote that piece, Washington’s explanations for the galloping CPI have expanded to include Putin’s invasion of Ukraine. More importantly, these explanations have now become a clown show. You know you’ve lost the argument when you’ve turned into cartoon fodder:[2]


Sometimes a good joke provides more insight than a multi-volume treatise! On the other hand, sometimes fact is funnier than fiction. Here is Speaker Nancy Pelosi’s proposed cure for inflation[3]:

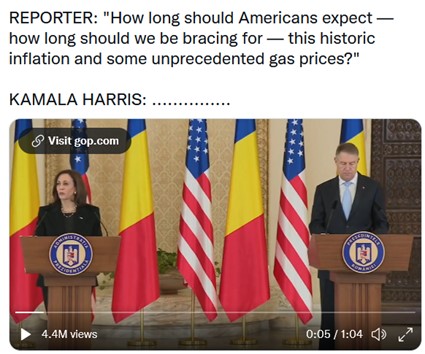
Not to be outdone, the Vice President served up some of her now famous “word salad” when asked about inflation.[4] If you’ve always marveled at the way politicians can transport themselves to another dimension to avoid a tough question, you’ll enjoy this. She has beamed herself way past the absurdity frontier.
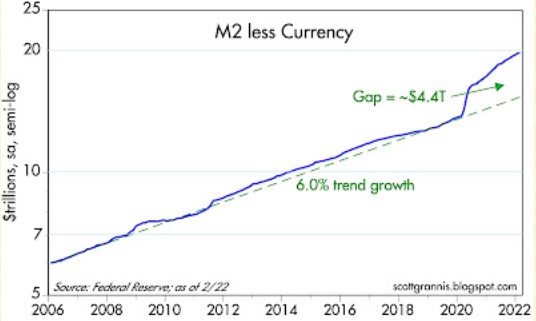
Clownish politicians aside, what is the outlook for inflation? How high might it go? Below is a chart of one measure of the money supply, M2 less currency.[5] As you can see, over the past two years it has grown roughly 33%, increasing from around $15 trillion to almost $20 trillion. Previous growth had been around 6% a year (12% over two years), so this means we have had roughly 21% excess cash injected into our economy’s ecosystem (33 minus 12).
How much inflation could this eventually cause? I imagine there are quite a few folks with PhDs in economics slaving over their algorithms this very moment to come up with that number. And I imagine, the law of prognosticating probabilities being what it is, a few of them will be right, and when the dust settles they will take out ads in The Wall St. Journal proclaiming their singular insight.
I don’t have any sophisticated formulas to make my inflation estimate, so I’ll rely on a calculator, a pencil, the back of an envelope and the 3 inputs I do have – money supply, GDP and CPI growth. Between 2006 and 2019, the money supply increased 6% annually. This translated into approximately 2% Real GDP growth and 2% inflation (1.77% and 1.92%, respectively, to be precise).[6] So, the money supply increased about 2 percentage points more than combined GDP and CPI, or looked at another way, 50% more.
What do these relationships imply for the current state of affairs? If we use the “2 percentage point” relationship, this translates into potential inflation of around 12%. (16% annual money supply growth over the past two years minus the 2% “overage” minus 2% economic growth).
If we use the “50% more relationship,” then we come up with an inflation rate of around 8.7% (16% annual money supply growth divided by 1.50 minus 2% economic growth).
The last CPI measurement was 7.9%, and both the housing component and “wage push” have not really juiced the rate yet, so my estimate is that we will probably see double digit inflation before the next recession. According to charts that I have kept going back to the 1960’s, the highest inflation rate we have suffered through on a trailing-12-month basis was 14.7% in March of 1980.[7] I got into the investment business in December of 1981, and never thought I’d live to see the day when we’d be dealing with this self-imposed misery. But it only takes a couple generations to forget the hard-earned lessons of the past.
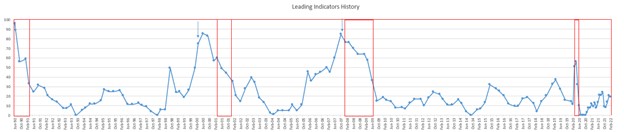
My Recession Indicators[8] – Speaking of the next recession, what impact has the Russian invasion and this continuing inflation had on my indicators? As you can see from the chart below, they are still hanging around the 20 level as of the end of March. We will not become actively worried until they head north of 60. At the moment, we do have some indicators in the housing, employment and interest rate areas which we are watching closely, as they may be on the verge of going negative.
Next Post – An Update on Housing
Don Harrison
The information contained in this report does not purport to be a complete description of the securities, markets, or developments referred to in this material. The information has been obtained from sources considered to be reliable, but we do not guarantee that the foregoing material is accurate or complete. Any opinions are those of the author and not necessarily those of Raymond James. Expressions of opinion are as of this date and are subject to change without notice. There is no guarantee that these statements, opinions or forecasts provided herein will prove to be correct. Investing involves risk and you may incur a profit or loss regardless of strategy selected. Keep in mind that individuals cannot invest directly in any index, and index performance does not include transaction costs or other fees, which will affect actual investment performance.
Individual investor's results will vary. Past performance does not guarantee future results. Future investment performance cannot be guaranteed, investment yields will fluctuate with market conditions.
The Consumer Price Index is a measure of inflation compiled by the U.S. Bureau of Labor Studies. US government bonds and treasury bills are guaranteed by the U.S. government and, if held to maturity, offer a fixed rate of return and guaranteed principal value. U.S. government bonds are issued and guaranteed as to the timely payment of principal and interest by the federal government.
inks are being provided for information purposes only. Raymond James is not affiliated with and does not endorse, authorize, or sponsor any of the listed websites or their respective sponsors. Raymond James is not responsible for the content of any website or the collection or use of information regarding any website’s users and/or members.
[1] https://www.capitalistinvestment.com/blog/2022/01/13/duh?sc_lang=en
[2] https://www.powerlineblog.com/archives/2022/03/the-week-in-pictures-biden-degringolade-edition.php
[3] https://twitter.com/thehill/status/1502449544797192192?ref_src=twsrc%5Etfw%7Ctwcamp%5Etweetembed%7Ctwterm%5E1502449544797192192%7Ctwgr%5E%7Ctwcon%5Es1_&ref_url=https%3A%2F%2Fwww.powerlineblog.com%2Farchives%2F2022%2F03%2Fit-isnt-just-slow-joe.php
[4] https://twitter.com/RNCResearch/status/1502301540962476032?ref_src=twsrc%5Etfw%7Ctwcamp%5Etweetembed%7Ctwterm%5E1502301540962476032%7Ctwgr%5E%7Ctwcon%5Es1_&ref_url=https%3A%2F%2Fwww.powerlineblog.com%2Farchives%2F2022%2F03%2Fveep-thoughts-by-kamala-harris-4.php
[5] http://scottgrannis.blogspot.com/2022/03/m2-growth-slows-but-its-still-too-fast.html
[6] https://www.macrotrends.net/2497/historical-inflation-rate-by-year and https://www.macrotrends.net/countries/USA/united-states/gdp-growth-rate
[7] https://www.bls.gov/charts/consumer-price-index/consumer-price-index-by-category-line-chart.htm
[8] Red boxes indicate recessions. The Capitalist Investment Leading Indicators is a composite comprised of the following data: Real Yields and the Yield Curve Slope; 1-10 Treasury Slope; Five Year vs. Overnight Risk Free Yields; 2-10 Treasury Spread; 2-10 Treasury Spread and Real Fed Funds; 10-30 Treasury Spread; 10-30 Treasury Spread and Real Fed Funds; 2 Yr. Swap Spreads; Corporate Credit Spreads; Corporate Profits as a % of GDP; Institute for Supply Mgn PMI; Capacity Utilization; 24 Month Payroll; Small Business Optimism; Small Business Hiring Plans; Consumer Confidence; Light Vehicle Sales; Unemployment Rate; State Unemployment Rates; Year/Year Change in Employment; Heavy Truck Sales; Initial Weekly Unemployment Claims; U.S. Household Leverage; Housing Starts; New Home Sales; NAHB Indicator; New Homes Supply; Housing Starts 12 Month Average; National Payments to Income Ratio
