
Weighing and Voting
In the short run the stock market acts like a “voting machine” (reflecting all kinds of irrational attitudes and expectations), while functioning in the long run more like a “weighing machine” (reflecting a firm’s true value).[1]
Warren Buffett
The Voting Machine
From late 2021 to October of 2023, the stock and bond markets behaved like Buffett’s voting machine, driven hither and yon by emotions as fleeting and confused as the lyrics of a Taylor Swift song.
In December of 2021, the 10-Year Treasury Bond yielded 1.4% while trailing 12 month-inflation, as measured by the Consumer Price Index, hit 7.2%.[2] That’s a negative real yield of -5.8%, meaning that investors who bought the bond were losing money relative to inflation. In June of 2022, the CPI hit its peak of 8.9% and the 10-year yield climbed to 3.4%, still a negative real return. From there until October of this year, the CPI declined to 3.1% but the 10-year yield rose to 5%.[3]
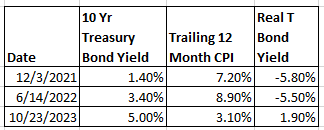
Investors had enough appetite for bonds when inflation was 7.2% -- and they were losing money in real terms -- to keep yields at 1.4%, but as inflation declined, that appetite dried up and the 10-Year’s yield rose to its highest level since June 2007. Looks to me like a classic example of security analysis by Buffett’s voting machine.
The behavior of the stock market during this time period was just as perplexing. In 2022, the S&P 500 declined (18%)[4] and the small-cap Russell 2000 fell (20%)[5]. This was not surprising at all; investors were grappling with an almost perfect storm of rising inflation, an aggressive Federal Reserve (it had engineered the quickest 5% increase in the Fed Funds rate in history[6]), and a first-quarter decline in real GNP.[7] What was surprising was the stock market’s performance through the first 9 months of 2023, when the S&P 500 gained almost 13%[8] but the Russell 2000 lagged significantly with a return of just under 3%.[9] This outperformance by the S&P occurred despite the fact that, according to JP Morgan, it began the year selling at a Price/Earnings Ratio roughly equal to its 20-year average and ended September having risen to a 14% premium. During this same time period the Russell traded at a bargain-basement P/E, languishing at a 16-22% discount to its long-term average.[10] Mr. Market appears to have had a schizophrenic episode, with the S&P 500 priced close to what you would normally see at a bull market top, while the smaller companies that comprise the Russell 2000 traded at bear market levels.
The Weighing Machine
And then in late October a funny thing happened on the way to the nut house: Mr. Market switched on The Weighing Machine, and stocks and bonds began to behave in what I would consider to be an almost rational manner. I say “almost” because the S&P continued along its irrational path, rising 15% from its low on 10/27 to sell at a P/E Ratio 25% above its 20-year average.[11] But the Russell and bonds exploded to the upside and outperformed the S&P, with the Russell gaining 22% from its low on 10/27 while the ICE US Treasury 20+ Year Bond Index rose 20%.[12] The Weighing Machine flashed “Small Caps and Bonds on Sale,” and Mr. Market finally got the message.
Why did it take almost all of 2023 for Mr. Market to recognize the attractive valuations of longer-term bonds and smaller companies? I believe the answer is “Fed Follies Redux.”
Fed Follies Redux
It’s been said that the definition of insanity is doing the same thing over and over again and expecting different results. I have been writing the same things about our misguided Federal Reserve for over three decades, but I have no expectations that they will change their beliefs, so I imagine that means I’m still sane. On the other hand, the Fed continues to make decisions based on both the long-discredited Phillips Curve and a misunderstanding of the root cause inflation. What to label their behavior I will leave to the reader’s imagination.
The Phillips Curve is named for Bill Phillips, a New Zealand economist who posited in the late 1950’s that there was a tradeoff between inflation and economic growth.[13] In other words, strong economic growth leads to higher demand for goods and services and pushes up prices, while a recession causes a softening in demand and lowers prices. The two best real-world tests of this theory – the 1970’s and the 1990’s – proved it wrong. During the ‘70’s, we had stubbornly high inflation and sluggish economic growth (“stagflation”), and during the ‘90’s we experienced a strong economy and low inflation. According to the Phillips Curve, stagflation and the stable prices of the dot.com boom should never have happened.
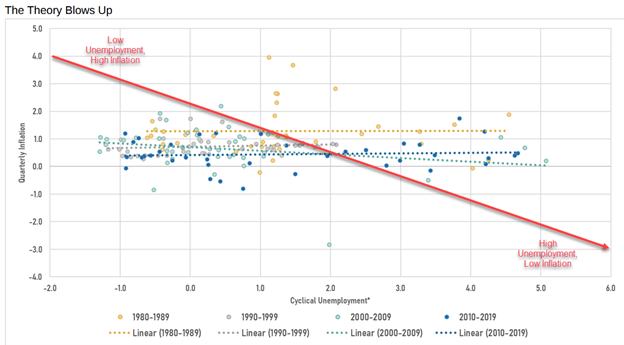
The good folks at The Committee to Unleash Prosperity have provided further real- world evidence that the Phillips Curve should be treated with the same intellectual respect we accord the phlogiston theory of combustion.[14] This chart[15] shows the relationship between inflation and unemployment in the 4 decades between 1980 and 2019. The horizontal axis runs from low unemployment on the left to high unemployment on the right, and the vertical one goes from low inflation at the bottom to high inflation at the top. If the Phillips Curve theory was correct, the dots would roughly follow the red line which I have added. As you can see, reality bears little resemblance to theory.
The stubborn, long-term persistence that the real world has demonstrated in refusing to conform to old Bill Phillips’ notion of how inflation and economic growth should work has not stopped the current Federal Reserve from using it to shape monetary policy. Back in August, Fed Chairman Jerome Powell said “getting inflation sustainably back down to 2 percent is expected to require a period of below-trend economic growth as well as some softening in labor market conditions.”[16] And Fed Governor Christopher Waller echoed the Chairman in November: “I am increasingly confident that policy is currently well positioned to slow the economy and get inflation back to 2 percent.”[17] This is Phillips-Curve speak: the Fed will bring inflation down by throttling the economy and raising unemployment. This approach did not encourage bullish sentiment in 2023.
In addition, the Fed’s misunderstanding of the root cause of inflation blinded them to the implications of its decline from its 2022 high, and the likelihood that it was on a path to meet the Fed’s 2 percent target (and perhaps go even lower) without any additional interest rate increases. I have quoted Milton Friedman on this subject many times, but at the risk of losing my sanity by repeating the same thing over and over and expecting different results, I will do so again:
In a talk in India in 1963, the great Milton Friedman said “inflation is always and everywhere a monetary phenomenon.”[18] What did he mean by that? He argued that “one could not find inflation anywhere in the world that was not caused by a prior increase in the supply of money or in the growth rate of the supply of money.”[19]
My favorite economist, Scott Grannis, has provided updated support for Friedman’s analysis:[20]
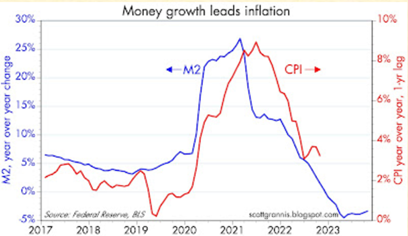
This is a chart of M2 money supply growth and the CPI, with a one-year lag. As you can see, M2 growth is a pretty reliable indicator of where inflation will be in a year. Since late 2022, its growth has been negative, so we should expect to see inflation hitting the Fed’s 2% target, and perhaps going even lower.
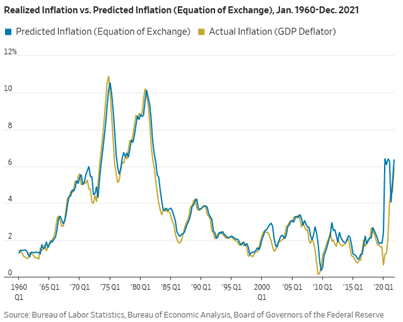
Economists Steve Hanke and Nicholas Hanlon used the quantity theory of money and its equation of exchange to find a similar link between M2 and inflation back in October of 2022.[21]
But Fed Chairman Powell has insisted all along that there is no causal relationship between price levels and the money supply:
Federal Reserve Chairman Jerome Powell still believes that inflation and the money supply are unconnected. He first made this remarkable assertion in his Semiannual Monetary Policy Report to Congress last February, saying that “the growth of M2 . . . doesn’t really have important implications for the economic outlook.” Since then, the U.S. annual inflation rate has climbed to 7.5% from 1.7%, but Mr. Powell hasn’t changed his mind. He doubled down during congressional testimony in December, arguing that the connection between money and inflation ended about 40 years ago.[22]
He sang from the same hymnal at the Cato Institute’s Monetary Conference in September of 2022:
“In an interview[23] at the Cato Institute . . . , Powell, at three points during the program, explicitly stated that the money supply has no impact on the economy, and he said that the money supply ‘does not play an important role in [the Federal Reserve’s] formulation of policy.’”[24]
As Steve Hanke and Caleb Hoffman have pointed out, it is surprising that Powell opines on this subject at all, given that he has admitted that “we now understand better how little we understand about inflation.”[25] I think dictionary.com could use Powell’s stance on inflation as a good example for their definition of folly: “the state or quality of being foolish; lack of understanding or sense.”[26]
Given the enormous influence that Fed policy has on interest rates and bond prices, it’s no wonder that Mr. Market would be spooked by a Federal Reserve that refused to acknowledge the relationship between the money supply and inflation, and that “he” would keep long term rates high for most of 2023.
Weighing or Voting in 2024?
Will the stock and bond markets behave more like a weighing or a voting machine in 2024? Though it’s always wise to keep the immortal Yogi Berra’s words in mind – “it’s hard to make predictions, especially about the future” – I believe that there is a good chance that 2024 will be a more rational, weighing-machine kind of year. (Except on November 5th, of course!)
If Scott Grannis is correct in his latest assessment of the direction of inflation and signs of weakness in the economy (here[27] and here[28]), then I believe the Federal Reserve will be forced to cut rates sooner than they now anticipate. This should extend the stock and bond market rallies that began in October, with the likelihood that the relatively undervalued small cap companies lead the way.
Don Harrison
Any opinions are those of Don Harrison and not necessarily those Raymond James Financial Services, Inc., or of Raymond James. The information contained in this presentation does not purport to be a complete description of the securities, markets, or developments referred to in this material. There is no assurance any of the trends mentioned will continue or forecasts will occur. The information has been obtained from sources considered to be reliable, but Raymond James does not guarantee that the foregoing material is accurate or complete. Any information is not a complete summary or statement of all available data necessary for making an investment decision and does not constitute a recommendation. Investing involves risk and you may incur a profit or loss regardless of strategy selected. Links are being provided for information purposes only. Raymond James is not affiliated with and does not endorse, authorize or sponsor any of the listed websites or their respective sponsors. Raymond James is not responsible for the content of any website or the collection or use of information regarding any website's users and/or members. The S&P 500 is an unmanaged index of 500 widely held stocks that is generally considered representative of the U.S. stock market. The Russell 2000 Value Index measures the performance of those Russell 2000 companies with lower price-to-book ratios and lower forecasted growth values. There is generally an inverse relationship between interest rate movements and bond prices.
[1] https://quoteinvestigator.com/2020/01/09/market/
[2] https://fred.stlouisfed.org/graph/?g=rocU
[3] https://fred.stlouisfed.org/graph/?g=rocU
[4] https://www.slickcharts.com/sp500/returns
[5] https://ycharts.com/indices/%5ERUTTR
[6] https://www.statista.com/chart/28437/interest-rate-hikes-in-past-tightening-cycles/
[7] https://fred.stlouisfed.org/series/GNPC96
[8] https://finance.yahoo.com/quote/SVSPX/performance/?guccounter=1&guce_referrer=aHR0cHM6Ly93d3cuZ29vZ2xlLmNvbS8&guce_referrer_sig=AQAAAI70iM0V7qchz5xiAYdpwMCYk8eNaBLZgGWvq9wxf5BqrCAEutYW3cptZBS7CRr1Pj2SX_729XHZqlIj4ZlaQGjHzdapZ89sh10M6tILsgvvYXbk3pFWXihRakMoA6fmJv-XcBd4_mmDVPOSNwYuI6HLirNr-iJPxzbJcrEezmO
[9] https://www.finsyn.com/wp-content/uploads/2023/10/3rd-Qtr-Market-Review-and-Commentary-Oct.-2023.pdf
[10] https://am.jpmorgan.com/us/en/asset-management/protected/adv/insights/market-insights/guide-to-the-markets/
[11] All figures as of 12/14/23
[12]https://www.google.com/finance/quote/IDCT20RT:INDEXNYSEGIS?sa=X&ved=2ahUKEwiZtNa1vJaDAxUdJEQIHfwIBmsQ3ecFegQIHxAf&window=1Y ICE rose 20% from its 10/19 low
[13] https://en.wikipedia.org/wiki/Phillips_curve
[14] https://en.wikipedia.org/wiki/Phlogiston_theory
[15] https://committeetounleashprosperity.com/hotlines/the-tyranny-of-the-phillips-curve/
[16] https://committeetounleashprosperity.com/hotlines/the-tyranny-of-the-phillips-curve/
[17] https://www.cnbc.com/2023/11/28/feds-waller-expresses-confidence-that-policy-is-in-the-right-place-to-bring-down- inflation.html#:~:text=Fed%20Governor%20Christopher%20Waller%20said,next%20three%20to%20five%20months.
[18] The Hoover Institution, 5/20/21, https://www.hoover.org/research/inflation-true-and-false
[19] The Hoover Institution, 5/20/21, https://www.hoover.org/research/inflation-true-and-false
[20] http://scottgrannis.blogspot.com/2023/11/a-reassuring-outlook.html
[21] https://www.wsj.com/articles/powell-printing-money-supply-m2-raises-prices-level-inflation-demand-prediction-wage-stagnation-stagflation-federal-reserve-monetary-policy-11645630424
[22] https://www.wsj.com/articles/powell-printing-money-supply-m2-raises-prices-level-inflation-demand-prediction-wage-stagnation-stagflation-federal-reserve-monetary-policy-11645630424
[23] https://www.youtube.com/watch?v=fVSmA30qWu0
[24] https://www.cato.org/commentary/feds-monetary-whiplash#
[25] https://www.cato.org/commentary/feds-monetary-whiplash#
[26] https://www.dictionary.com/browse/folly
[27] http://scottgrannis.blogspot.com/2024/01/economic-slowdown-on-top-of-lower.html
[28] http://scottgrannis.blogspot.com/2024/01/more-disinflation-no-recession-us-king.html
