
The Tale of the Tape and This Correction
I pay almost no attention to boxing anymore, but back in the day when I eagerly awaited every epic battle between Ali and Frazier or Leonard and Duran, there was always a pre-fight analysis called the “tale of the tape.” This was exactly what the name implied. It compared a boxer’s height, reach, weight and age – statistics that were easily measurable – to try to determine who might have an advantage.
One way to look at the behavior of the stock market over a full market cycle – from bull to bear and back again – is to think of it in terms of a boxing match. In one corner we have “Sugar Ray Earnings” – the total earnings of all the stocks in the market. In the other corner stands “Roberto Rates” – the level of interest rates and the relationship between short and long-term levels.
When the bell rings at the start of a bull market, “Earnings” looks a little tentative at first but soon he’s peppering “Rates” with left jabs and smacking him in the snoot with hard rights. “Rates” is almost helpless as “Earnings” – younger, faster, taller –drives him around the ring at will. But from time to time, the always tough and resilient “Rates” lands a left cross or a right to the gut that staggers “Earnings” but doesn’t quite knock him down. Eventually, “Earnings” exhausts himself and one of those hard punches knocks him to canvas and ushers in a bear market.
But of course, unlike a real boxing match, this fight never ends. “Earnings” gets up, goes to his corner for a whiff of smelling salts, and comes out swinging to start the next bull market.
Right now, “Earnings” is firing on all cylinders. According to CNBC’s Bob Pisani:
Half of the S&P will have reported by the end of the day today, and it is turning into an extraordinary quarter. Earnings are up nearly 15% from the same period a year ago, and keep rising, according to Thomson Reuters. That is a blended estimate, and includes companies that have not reported yet. If you just count the companies that have already reported, the actual earnings are up 17.3%. That would be the highest growth since the third quarter of 2011. Far more are beating estimates (nearly 80%) than the average (64%), and they are beating by a wider margin.
Most importantly, revenue growth has returned. The earnings gains are no longer coming primarily from cost cutting: revenue growth, at 8.0 percent, is the highest since the third quarter of 2011, and 82% are beating the revenue estimates (also far higher than the 60% average). As with earnings, they are beating by a wider margin (6.1percent), more than twice the average of 3.1 percent.[1]
Even more impressive, we’re pretty far along in this current match. The growth in 2011 was not too soon after the bell had rung to start this bull market, when “Sugar Ray Earnings” was fresh and energetic. I think some of this second wind for “Earnings” comes from the fact that we had an oil-induced mini-recession in 2015, and the yield on the 10-year Treasury Note fell from 2.5% to 1.3%.
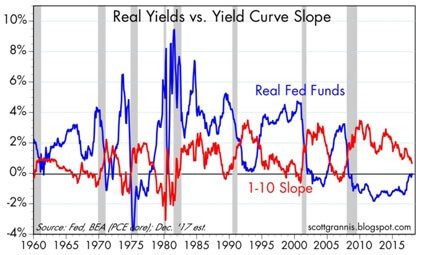
But “Roberto Rates” has now gathered himself enough to land a hard punch. As I pointed out on January 19th,[2] the direction in which key interest rates are moving means that a recession is closer than it was a few years ago. I think the recent market correction was “Roberto” knocking the wind out of “Sugar Ray.” This happens on a fairly regular basis during bull markets. Since 1932, the S&P 500 has corrected 5%, on average, every 7.1 months and corrected 10%, on average, every 25.9 months.[3] But I also believe that “Earnings” still has a number of rounds left before he ends up on the canvas.
[4]
Two Interesting Charts
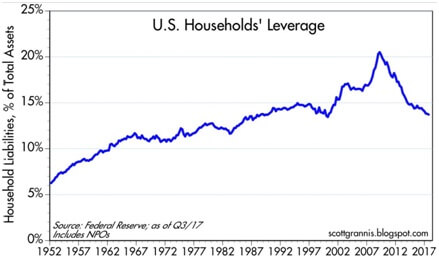
I think there is decent chance that rising interest rates could take longer than normal to unbalance the economic ecosystem. The chart below shows total U.S. household’s debt as a percentage of total assets.[5] It is now lower than the level that preceded both of the last recessions. This time around, increasing rates could have less effect on consumers.
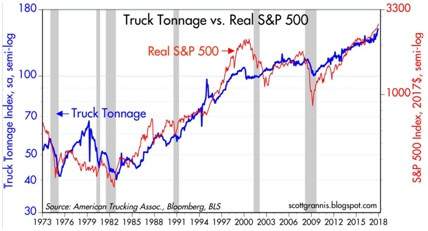
This chart compares truck tonnage to the S&P 500. It looks to me like it’s a pretty good leading indicator. Before each of the last 4 recessions, it either declined sharply or flattened out. Right now it looks like a rocket launch.[6]
The information contained in this report does not purport to be a complete description of the markets, or developments referred to in this material. The information has been obtained from sources considered to be reliable, but we do not guarantee that the foregoing material is accurate or complete. Any information is not a complete summary or statement of all available data necessary for making an investment decision and does not constitute a recommendation. Any opinions are those of Don Harrison, and are not necessarily those of RJFS or Raymond James. Expressions of opinion are as of this date and are subject to change without notice.
Investing for the long-term does not ensure a profitable outcome. Investing involves risk and you may incur a profit or loss regardless of strategy selected. The S&P 500 is an unmanaged index of 500 widely held stocks that is generally considered representative of the U.S. stock market. Keep in mind that individuals cannot invest directly in any index, and index performance does not include transaction costs or other fees, which will affect actual investment performance. Individual investor’s results will vary. Past performance does not guarantee future results
Links are being provided for information purposes only. Raymond James is not affiliated with and does not endorse, authorize or sponsor any of the listed websites or their respective sponsors. Raymond James is not responsible for the content of any website or the collection or use of information regarding any website’s users and/or members.
[1] Investment Strategy: “The 7% Solution”, Jeffrey Saut, Raymond James Investment Strategy, https://myrjnet.rjf.com/ResearchandPlanning/InvestmentStrategy/MarketandEconomicCommentary/MarketStrategybyJeffSaut/Pages/default.aspx
[2] The Next Bear Market, Don Harrison, Capitalist Investment Services Blog, 1/19/18 http://capitalistinvestment.com/2018/01/the-next-bear-market/
[3] Charts of the Week, Andrew Adams, Raymond James Investment Strategy, 2/7/18 https://myrjnet.rjf.com/ResearchandPlanning/InvestmentStrategy/MarketandEconomicCommentary/MarketStrategybyJeffSaut/Pages/default.aspx
[4] The Fed Is Not Yet a Problem, Scott Grannis, Calafia Beach Pundit, 12/14/17 http://scottgrannis.blogspot.com/2017/12/the-fed-is-not-yet-problem.html
[5] Wealthier and Wealthier, Scott Grannis, Calafia Beach Pundit, 12/7/17. http://scottgrannis.blogspot.com/2017/12/wealthier-and-wealthier.html
[6] Truck Tonnage Is Impressive, Scott Grannis, Calafia Beach Pundit, 12/21/17 http://scottgrannis.blogspot.com/2017/12/truck-tonnage-is-impressive.html
